Checkpoints
Use Terraform to set up the necessary infrastructure
/ 50
View Logs in BigQuery
/ 50
Cloud Logging on Kubernetes Engine
- GSP483
- Overview
- Architecture
- Setup
- Task 1. Clone demo
- Task 2. Deployment
- Task 3. Validation
- Task 4. Generating logs
- Task 5. Logs in Cloud Logging
- Task 6. Viewing log exports
- Task 7. Logs in Cloud Storage
- Task 8. Logs in BigQuery
- Task 9. Teardown
- Task 10. Troubleshooting for your production environment
- Congratulations
GSP483

Overview
Cloud Logging can be used aggregate logs from all Google Cloud resources, as well as any custom resources on other platforms, to allow for one centralized store for all logs and metrics. Logs are aggregated and then viewable within the provided Cloud Logging UI. They can also be exported to Sinks to support more specialized of use cases. Currently, Cloud Logging supports exporting to the following sinks:
- Cloud Storage
- Pub/Sub
- BigQuery
In this lab you will deploy a sample application to Kubernetes Engine that forwards log events to Cloud Logging using Terraform, a declarative Infrastructure as Code tool that enables configuration files to automate the deployment and evolution of infrastructure in the cloud. The configuration will also create a Cloud Storage bucket and a BigQuery dataset for exporting log data to.
This lab was created by GKE Helmsman engineers to give you a better understanding of Cloud Logging. You can view this demo by running gsutil cp -r gs://spls/gke-binary-auth/* . and cd gke-binary-auth-demo command in cloud shell. We encourage any and all to contribute to our assets!
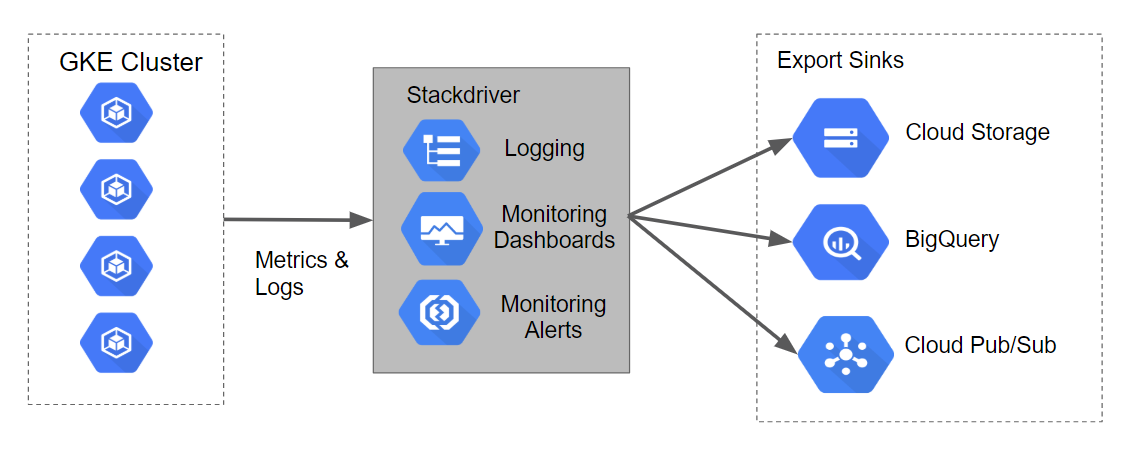
Architecture
The Terraform configurations are going to build a Kubernetes Engine cluster that will generate logs and metrics that can be ingested by Stackdriver. The scripts will also build out Logging Export Sinks for Cloud Storage, BigQuery, and Cloud Pub/Sub.
The diagram of how this will look along with the data flow can be seen in the following graphic:
Setup
Before you click the Start Lab button
Read these instructions. Labs are timed and you cannot pause them. The timer, which starts when you click Start Lab, shows how long Google Cloud resources will be made available to you.
This hands-on lab lets you do the lab activities yourself in a real cloud environment, not in a simulation or demo environment. It does so by giving you new, temporary credentials that you use to sign in and access Google Cloud for the duration of the lab.
To complete this lab, you need:
- Access to a standard internet browser (Chrome browser recommended).
- Time to complete the lab---remember, once you start, you cannot pause a lab.
How to start your lab and sign in to the Google Cloud console
-
Click the Start Lab button. If you need to pay for the lab, a pop-up opens for you to select your payment method. On the left is the Lab Details panel with the following:
- The Open Google Cloud console button
- Time remaining
- The temporary credentials that you must use for this lab
- Other information, if needed, to step through this lab
-
Click Open Google Cloud console (or right-click and select Open Link in Incognito Window if you are running the Chrome browser).
The lab spins up resources, and then opens another tab that shows the Sign in page.
Tip: Arrange the tabs in separate windows, side-by-side.
Note: If you see the Choose an account dialog, click Use Another Account. -
If necessary, copy the Username below and paste it into the Sign in dialog.
{{{user_0.username | "Username"}}} You can also find the Username in the Lab Details panel.
-
Click Next.
-
Copy the Password below and paste it into the Welcome dialog.
{{{user_0.password | "Password"}}} You can also find the Password in the Lab Details panel.
-
Click Next.
Important: You must use the credentials the lab provides you. Do not use your Google Cloud account credentials. Note: Using your own Google Cloud account for this lab may incur extra charges. -
Click through the subsequent pages:
- Accept the terms and conditions.
- Do not add recovery options or two-factor authentication (because this is a temporary account).
- Do not sign up for free trials.
After a few moments, the Google Cloud console opens in this tab.

Activate Cloud Shell
Cloud Shell is a virtual machine that is loaded with development tools. It offers a persistent 5GB home directory and runs on the Google Cloud. Cloud Shell provides command-line access to your Google Cloud resources.
- Click Activate Cloud Shell
at the top of the Google Cloud console.
When you are connected, you are already authenticated, and the project is set to your Project_ID,
gcloud is the command-line tool for Google Cloud. It comes pre-installed on Cloud Shell and supports tab-completion.
- (Optional) You can list the active account name with this command:
- Click Authorize.
Output:
- (Optional) You can list the project ID with this command:
Output:
gcloud, in Google Cloud, refer to the gcloud CLI overview guide.
Task 1. Clone demo
- In Cloud Shell top ribbon, click Open in new window:

- Run the following command to set your Google Cloud project ID, replacing
<YOUR_PROJECT_ID>with your Qwiklabs Project ID:
- Now clone the resources needed for this lab:
- Now change your the directory for this demo:
Set your region and zone
Certain Compute Engine resources live in regions and zones. A region is a specific geographical location where you can run your resources. Each region has one or more zones.
Run the following to set a region and zone for your lab (you can use the region/zone that's best for you):
Task 2. Deployment
Following the principles of Infrastructure as Code and Immutable Infrastructure, Terraform supports the writing of declarative descriptions of the desired state of infrastructure. When the descriptor is applied, Terraform uses Google Cloud APIs to provision and update resources to match.
Terraform compares the desired state with the current state so incremental changes can be made without deleting everything and starting over. For instance, Terraform can build out Google Cloud projects and compute instances, etc., even set up a Kubernetes Engine cluster and deploy applications to it. When requirements change, the descriptor can be updated and Terraform will adjust the cloud infrastructure accordingly.
This lab will start up a Kubernetes Engine cluster and deploy a simple sample application to it. By default, Kubernetes Engine clusters in Google Cloud are provisioned with a pre-configured Fluentd-based collector that forwards logs to Cloud Logging. Interacting with the sample app will produce logs that are visible in the Cloud Logging and other log event sinks.
Update the provider.tf file
-
Remove the provider version for the Terraform from the
provider.tfscript file. -
In Cloud Shell Editor tab, Select File>Open and then click Open. From the left-hand menu, open the file
/gke-logging-sinks-demo/terraform/provider.tf. -
Set the version to
~> 2.19.0. After modification yourprovider.tfscript file should look like:
- Save and close the file.
Deploying the cluster
There are three Terraform files provided with this lab example.
The first one, main.tf, is the starting point for Terraform. It describes the features that will be used, the resources that will be manipulated, and the outputs that will result.
The second file is provider.tf, which indicates which cloud provider and version will be the target of the Terraform commands--in this case Google Cloud.
The final file is variables.tf, which contains a list of variables that are used as inputs into Terraform. Any variables referenced in the main.tf that do not have defaults configured in variables.tf will result in prompts to the user at runtime.
-
You will make one small change to
main.tf. From the left-hand menu, open the file/gke-logging-sinks-demo/terraform/main.tf. -
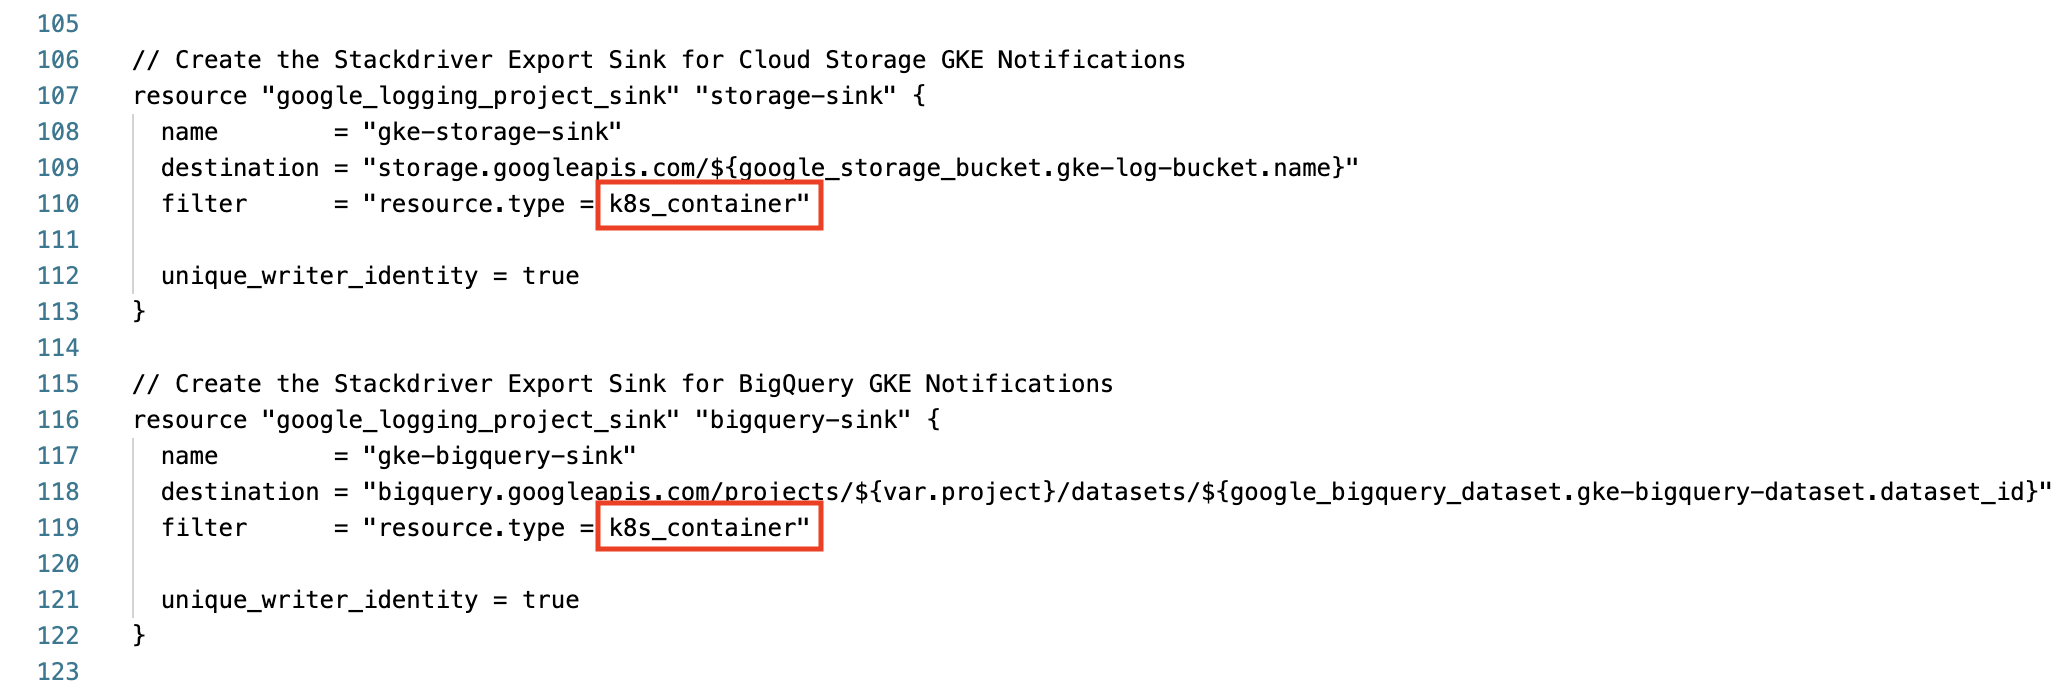
Scroll down to line 110 and find the "Create the Stackdriver Export Sink for Cloud Storage GKE Notifications" section.
-
Change the filter's
resource.typefrom container to k8s_container. -
Do the same for the bigquery-sink on line 119. Ensure that these two export sync sections look like the following before moving on:
-
Save and close the file.
-
Now run the following command to build out the executable environment using the
makecommand:
Test completed task
Click Check my progress to verify your performed task. If you have successfully deployed necessary infrastructure with Terraform, you will see an assessment score.
Task 3. Validation
If no errors are displayed during deployment, after a few minutes you should see your Kubernetes Engine cluster in the Cloud Console.
-
Go to Navigation menu > Kubernetes Engine > Clusters to see the cluster with the sample application deployed.
-
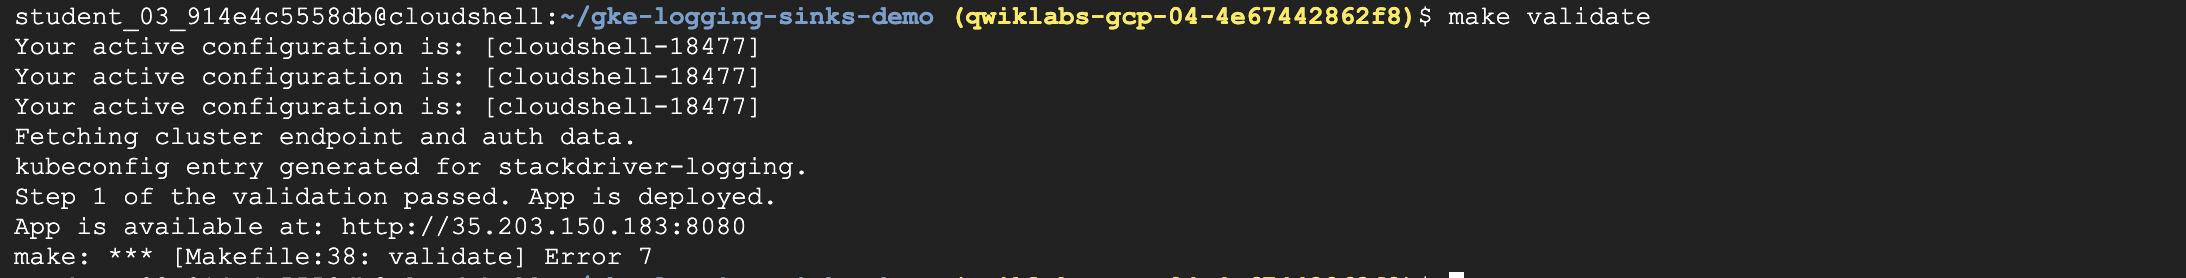
To validate that the demo deployed correctly, run:
Your output will look like this:
Now that the application is deployed to Kubernetes Engine you can generate log data and use Cloud Logging and other tools to view it.
Task 4. Generating logs
The sample application that Terraform deployed serves up a simple web page.
Each time you open this application in your browser the application will publish log events to Cloud Logging. When you refresh the page a few times to produce several log events.
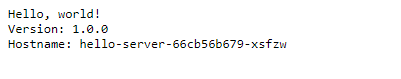
To get the URL for the application page, perform the following steps:
- In the Cloud console, from the Navigation menu, go to the Networking section and click on Network services.
- On the default Load balancing page, click on the name of the TCP load balancer that was set up.
- On the Load balancer details page the top section labeled Frontend.
- In the Frontend, copy the
IP:PortURL value. Open a new browser and paste the URL. The browser should return a screen that looks similar to the following:
Task 5. Logs in Cloud Logging
Cloud Logging provides a UI for viewing log events. Basic search and filtering features are provided, which can be useful when debugging system issues.
Cloud Logging is best suited to exploring more recent log events. Users requiring longer-term storage of log events should consider some of the tools you'll explore in the following sections.
To access the cloud Logging console perform the following steps:
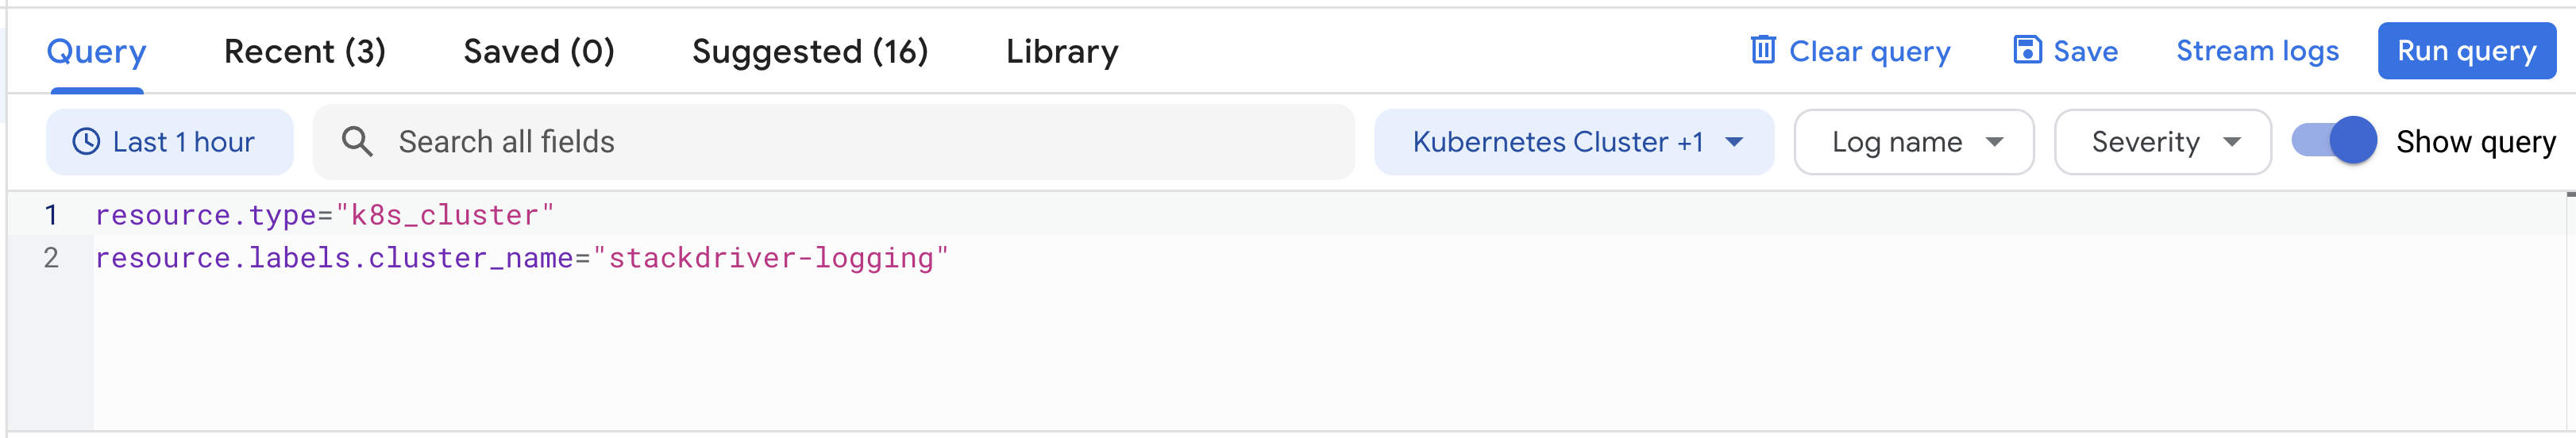
- In the Cloud Console, from the Navigation menu, in the Operations section, click on Logging.
- On this page, select the
Resource typeto Kubernetes Container,cluster_nameto stackdriver-logging.
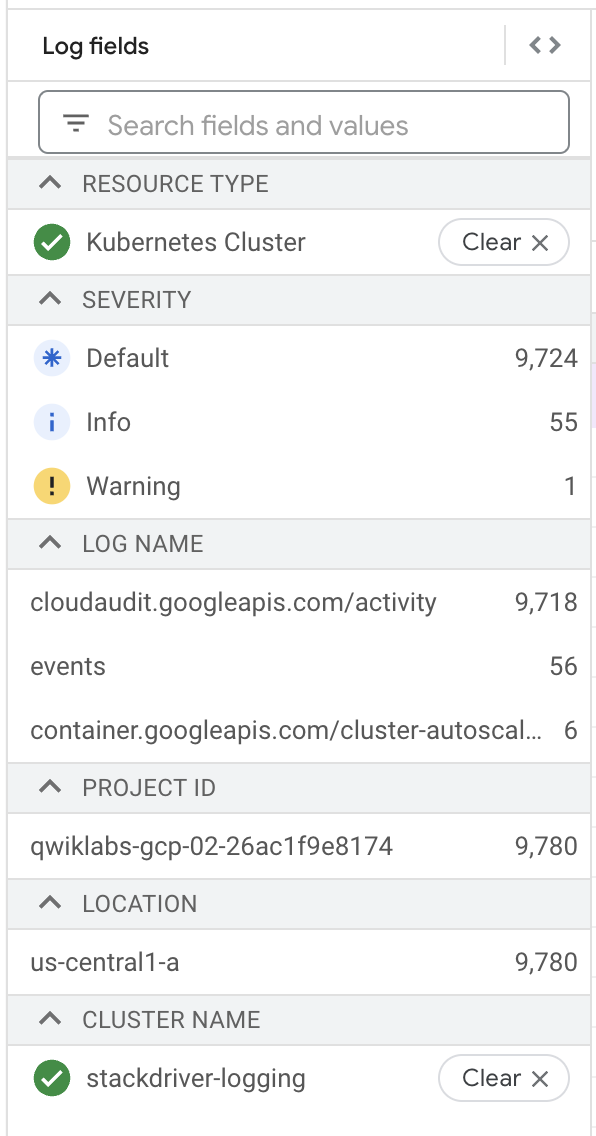
- Now click Run Query.
- In Query results, you can expand the bulleted log items to view more details about a log entry.
On the Logging console, you can build queries using Query builder, or try out various features like log fields, time zone, etc.
Task 6. Viewing log exports
The Terraform configuration built out two Log Export Sinks. To view the sinks perform the following steps:
- You should still be on the Logging page.
- In the left navigation menu, click on Logs Router.
- You should see four Sinks in the list of log exports.
- You can edit/view these sinks by clicking on the context menu (three dots) to the right of a sink and selecting the Edit sink option.
- Additionally, you could create additional custom export sinks by clicking on the Create Sink option in the top of the navigation window.
Task 7. Logs in Cloud Storage
Log events can be stored in Cloud Storage, an object storage system suitable for archiving data.
Policies can be configured for Cloud Storage buckets that, for instance, allow aging data to expire and be deleted while more recent data can be stored with a variety of storage classes affecting price and availability.
The Terraform configuration created a Cloud Storage Bucket named stackdriver-gke-logging- to which logs will be exported for medium to long-term archival.
In this example, the Storage Class for the bucket is defined as Nearline because the logs should be infrequently accessed in a normal production environment (this will help to manage the costs of medium-term storage). In a production scenario, this bucket may also include a lifecycle policy that moves the content to Coldline storage for cheaper long-term storage of logs.
To access the logs in Cloud Storage perform the following steps:
- In the Cloud Console from the Navigation menu, click Cloud Storage.
- Find the Bucket with the name
stackdriver-gke-logging-<random-Id>, and click on the name. - Unfortunately, it takes a while for sinks to propagate to Cloud Storage so you probably will not see any log details in your bucket.
If you come back to the bucket towards the end of your lab you might see folders corresponding to pods running in the cluster (e.g. autoscaler, dnsmasq, etc.).
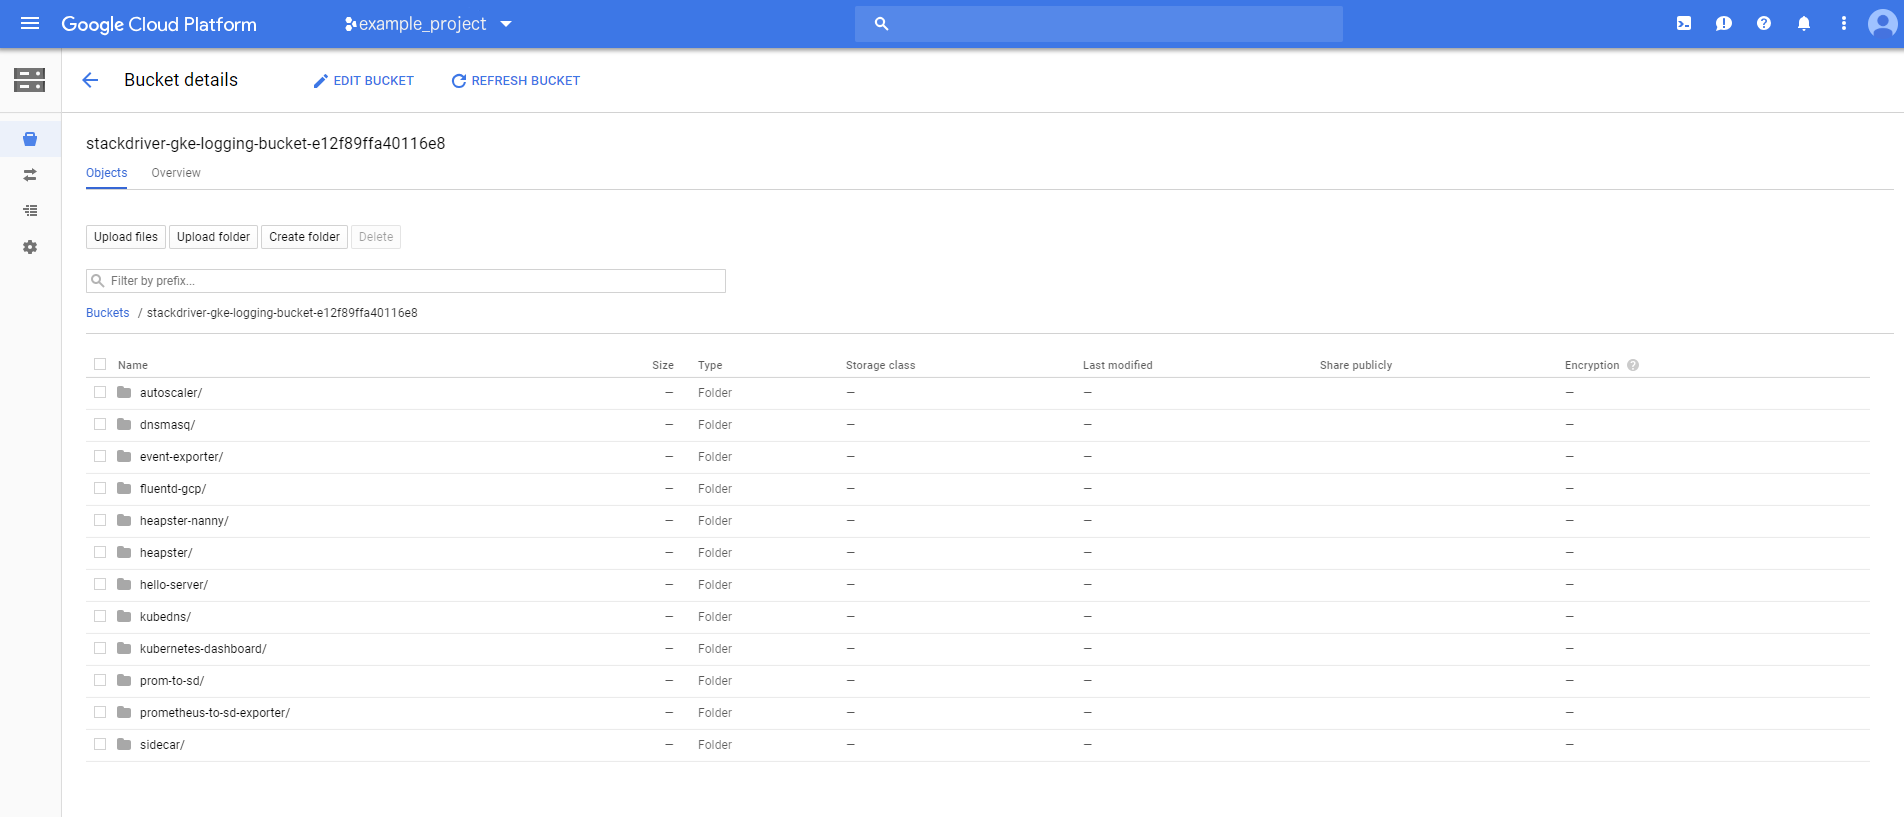
You can click into any of the folders to browse specific log details like heapster, kubedns, sidecar, etc.
Task 8. Logs in BigQuery
Log events can be configured to be published to BigQuery, a data warehouse tool that supports fast, sophisticated, querying over large data sets.
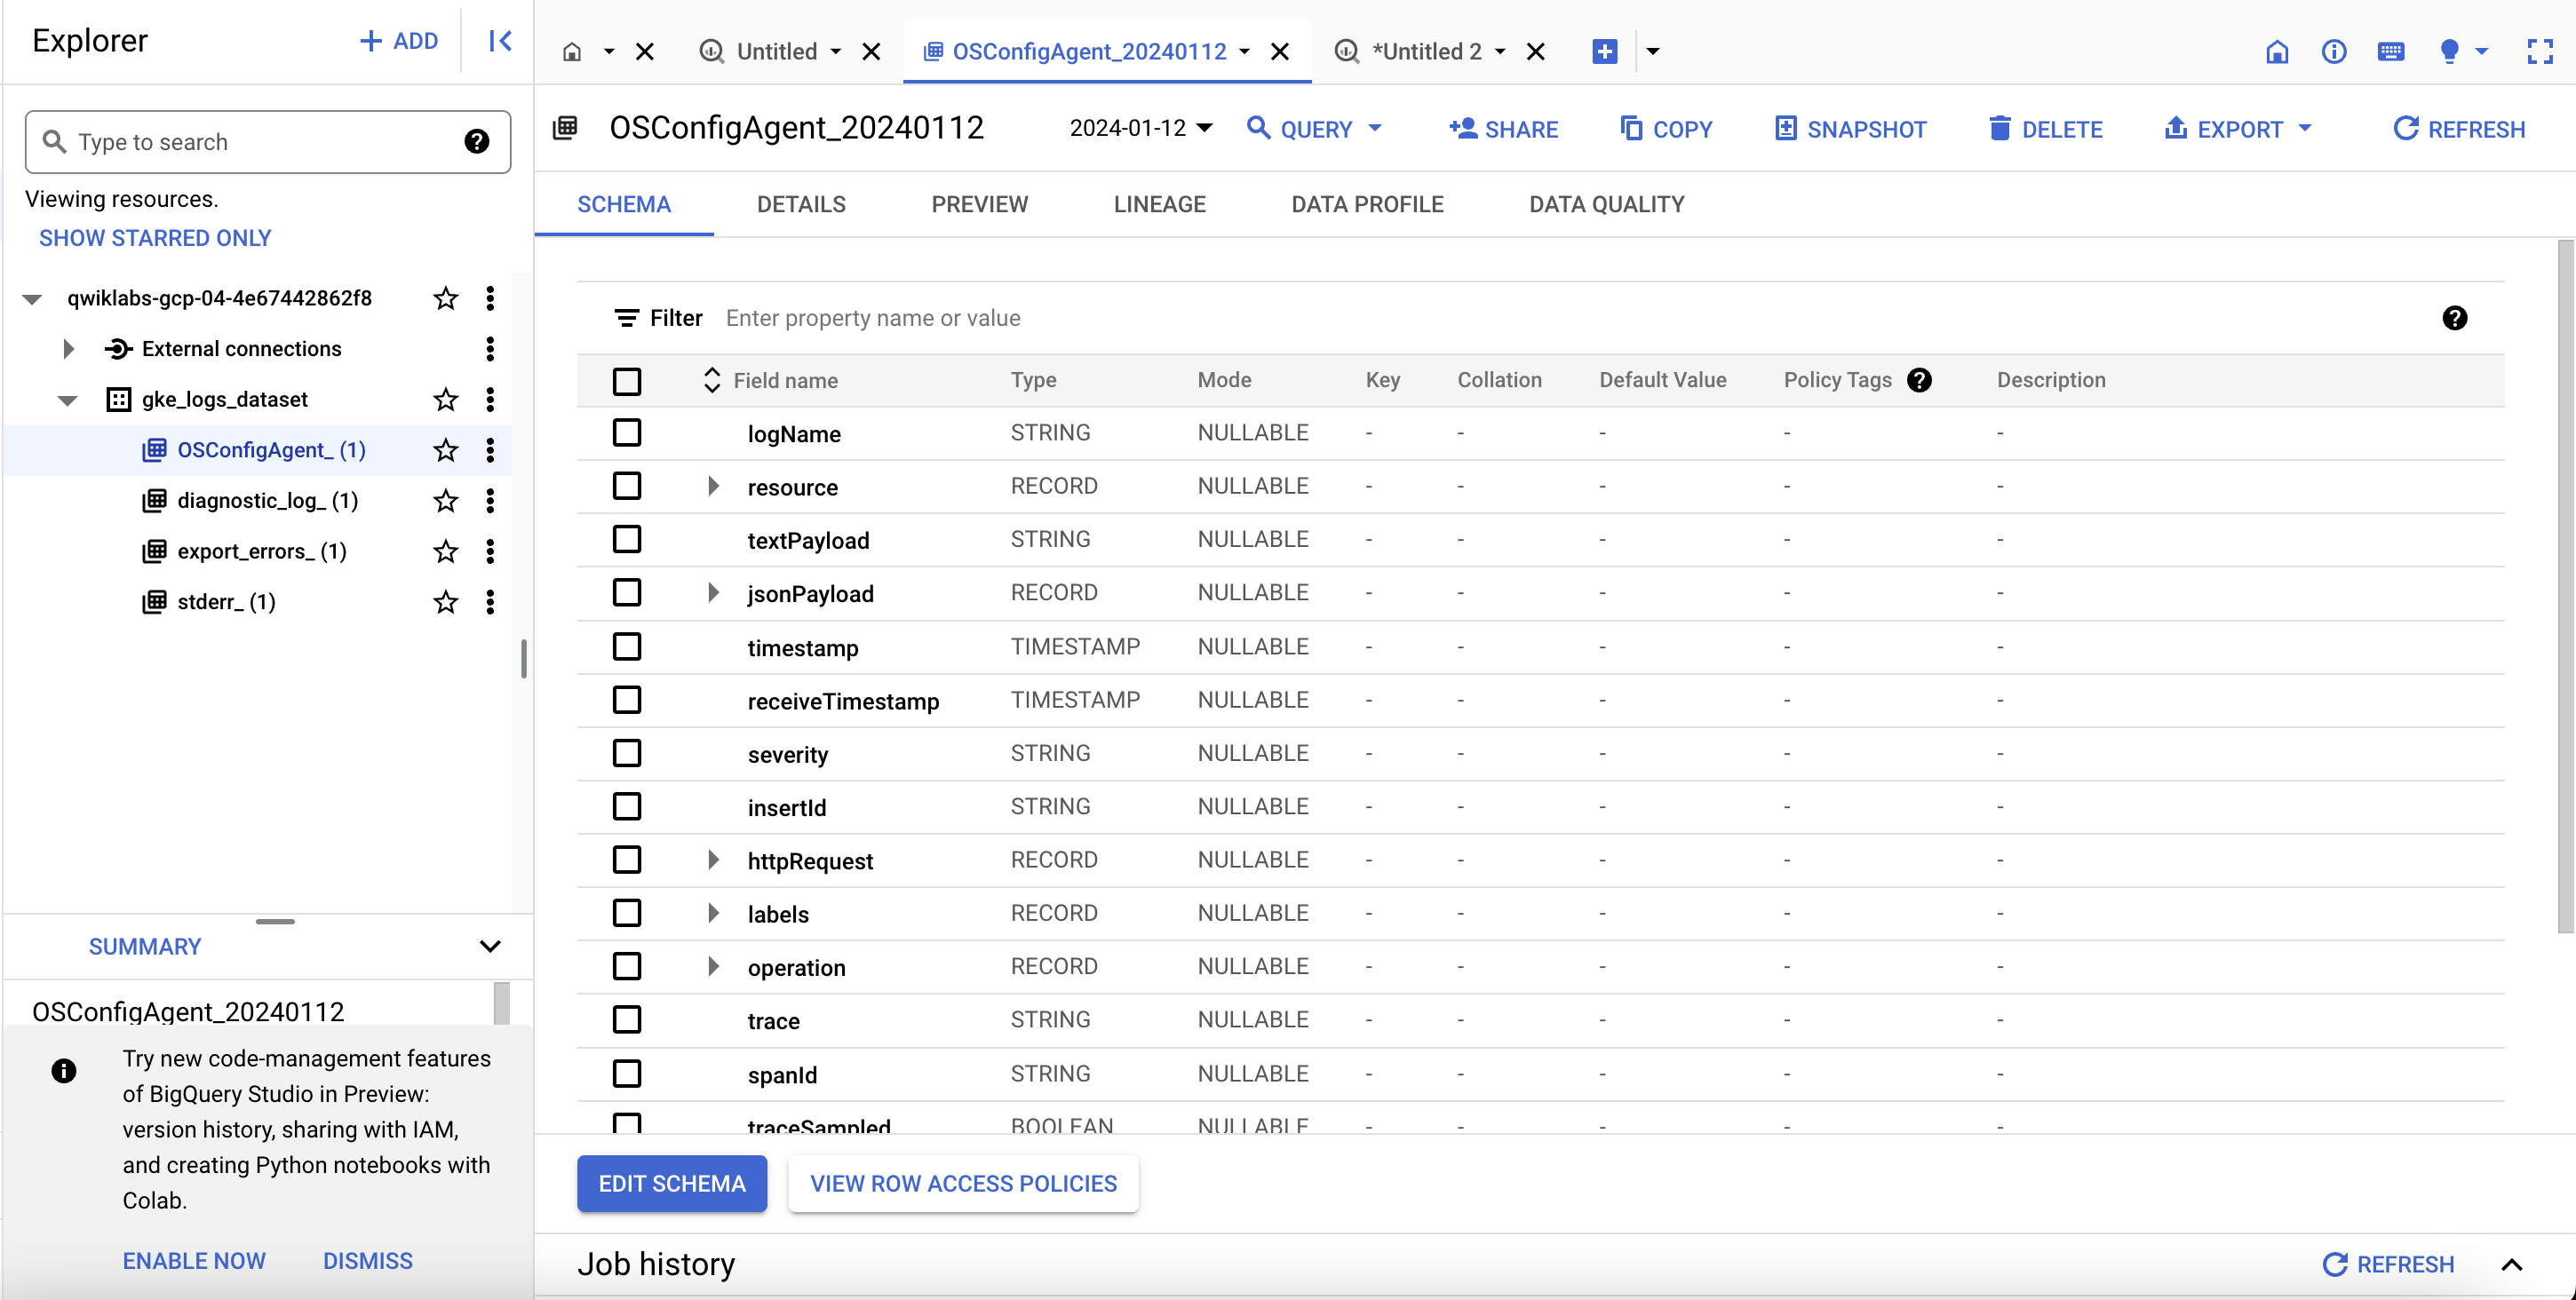
The Terraform configuration will create a BigQuery DataSet named gke_logs_dataset. This dataset will be set up to include all Kubernetes Engine related logs for the last hour (by setting a Default Table Expiration for the dataset). Kubernetes Engine container logs will be pushed to the dataset.
To access the logs in BigQuery, perform the following steps:
-
From the Navigation menu, in the Big Data section, click on BigQuery, if
Welcome to BigQuery in the Cloud Consolemessage box opens. Click Done. -
In the left menu, click on your project name. You should see a dataset named gke_logs_dataset. Expand this dataset to view the tables that exist.
Note: The dataset is created immediately, but the tables are generated as logs are written and new tables are needed. -
Click on one of the tables to view the table details.
-
Review the schema of the table to note the column names and their data types. This information can be used in the next step when you query the table to look at the data.
-
Click on Query > In new tab towards the top right to perform a custom query against the table.
-
This adds a query to the Query Editor, but it has a syntax error.
-
Edit the query to add an asterisk (*) after Select to pull in all details from the current table.
Note: A Select *query is generally very expensive and not advised. For this lab the dataset is limited to only the last hour of logs, so the overall dataset is relatively small. -
Click Run to execute the query and return some results from the table.
The results window should display some rows and columns. You can scroll through the various rows of data that are returned. If you want, execute some custom queries that filter for specific data based on the results that were shown in the original query.
Test completed task
Click Check my progress to verify your performed task. If BigQuery sink written logs in BigQuery dataset, you will see an assessment score.
Task 9. Teardown
- Qwiklabs will take care of shutting down all the resources used for this lab, but here’s what you would need to do to clean up your own environment to save on cost and to be a good cloud citizen:
Since Terraform tracks the resources it created, it is able to tear them all down.
Task 10. Troubleshooting for your production environment
The install script fails with a Permission denied when running Terraform.
The credentials that Terraform is using do not provide the necessary permissions to create resources in the selected projects.
-
Ensure that the account listed in
gcloud config listhas necessary permissions to create resources. -
If it does, regenerate the application default credentials using
gcloud auth application-default login.
Cloud Storage Bucket not populated
Once the Terraform configuration is complete the Cloud Storage Bucket will be created, but it is not always populated immediately with log data from the Kubernetes Engine cluster.
Give the process some time because it can take up to 2 to 3 hours before the first entries start appearing. Learn more about Cloud Storage in the View logs in sink destinations documentation.
No tables created in the BigQuery dataset
Once the Terraform configuration is complete the BigQuery Dataset will be created but it will not always have tables created in it by the time you go to review the results.
The tables are rarely populated immediately.
Give the process some time (minimum of 5 minutes) before determining that something is not working properly.
Congratulations
Finish your quest
This self-paced lab is part of the Google Cloud's Operations Suite on GKE and Google Cloud Logging quests. A quest is a series of related labs that form a learning path. Completing a quest earns you a badge to recognize your achievement. You can make your badge (or badges) public and link to them in your online resume or social media account. Enroll in either quest and get immediate completion credit if you've taken this lab. See the Google Cloud Skills Boost catalog to see all available quests.
Next steps / learn more
- Kubernetes Engine Logging
- Viewing Logs
- Advanced Logs Filters
- Overview of Logs Exports
- Processing Logs at Scale Using Cloud Dataflow
- Terraform Google Cloud Provider
Google Cloud training and certification
...helps you make the most of Google Cloud technologies. Our classes include technical skills and best practices to help you get up to speed quickly and continue your learning journey. We offer fundamental to advanced level training, with on-demand, live, and virtual options to suit your busy schedule. Certifications help you validate and prove your skill and expertise in Google Cloud technologies.
Manual Last Updated: January 12, 2024
Lab Last Tested: January 12, 2024
Copyright 2024 Google LLC. This software is provided as-is, without warranty or representation for any use or purpose. Your use of it is subject to your agreement with Google.