Checkpoints
Launch Looker Studio and create a blank report
/ 100
Explore and Create Reports with Looker Studio
GSP409

Overview
Looker Studio turns your data into informative dashboards and reports that are easy to read, easy to share, and fully customizable. Dashboarding allows you to tell great data stories to support better business decisions.
BigQuery is Google's fully managed, NoOps, low cost analytics database. With BigQuery you can query terabytes and terabytes of data without having any infrastructure to manage or needing a database administrator. BigQuery uses SQL and can take advantage of the pay-as-you-go model. BigQuery allows you to focus on analyzing data to find meaningful insights.
The dataset used in this lab is an ecommerce dataset that has millions of Google Analytics records for the Google Merchandise Store loaded into BigQuery. You will explore the available fields and rows of the dataset for insights.
This lab focuses on how to create new reports and explore your ecommerce dataset visually for insights.
What you'll learn
In this lab, you learn how to:
- Launch Looker Studio
- Create and customize a report
- Create an interactive filter for your report
Setup and requirements
Before you click the Start Lab button
Read these instructions. Labs are timed and you cannot pause them. The timer, which starts when you click Start Lab, shows how long Google Cloud resources will be made available to you.
This hands-on lab lets you do the lab activities yourself in a real cloud environment, not in a simulation or demo environment. It does so by giving you new, temporary credentials that you use to sign in and access Google Cloud for the duration of the lab.
To complete this lab, you need:
- Access to a standard internet browser (Chrome browser recommended).
- Time to complete the lab---remember, once you start, you cannot pause a lab.
Task 1. Launch Looker Studio and create a blank report
- Open Looker Studio in a new browser tab or window.
The Looker Studio home page opens.
-
From the homepage, click the Blank report template:
-
Click through the following prompts:
- Select Country name and enter a Company name. Check the checkbox to acknowledge you have read and agree to the Looker Studio Additional Terms, then click Continue.
- On the Sign up for emails to get the most out of Looker Studio dialog, select "No" to all options, then click Continue.
-
Click the Blank report template again.
A new, untitled report opens.
-
You'll be on the Connect to data tab.
-
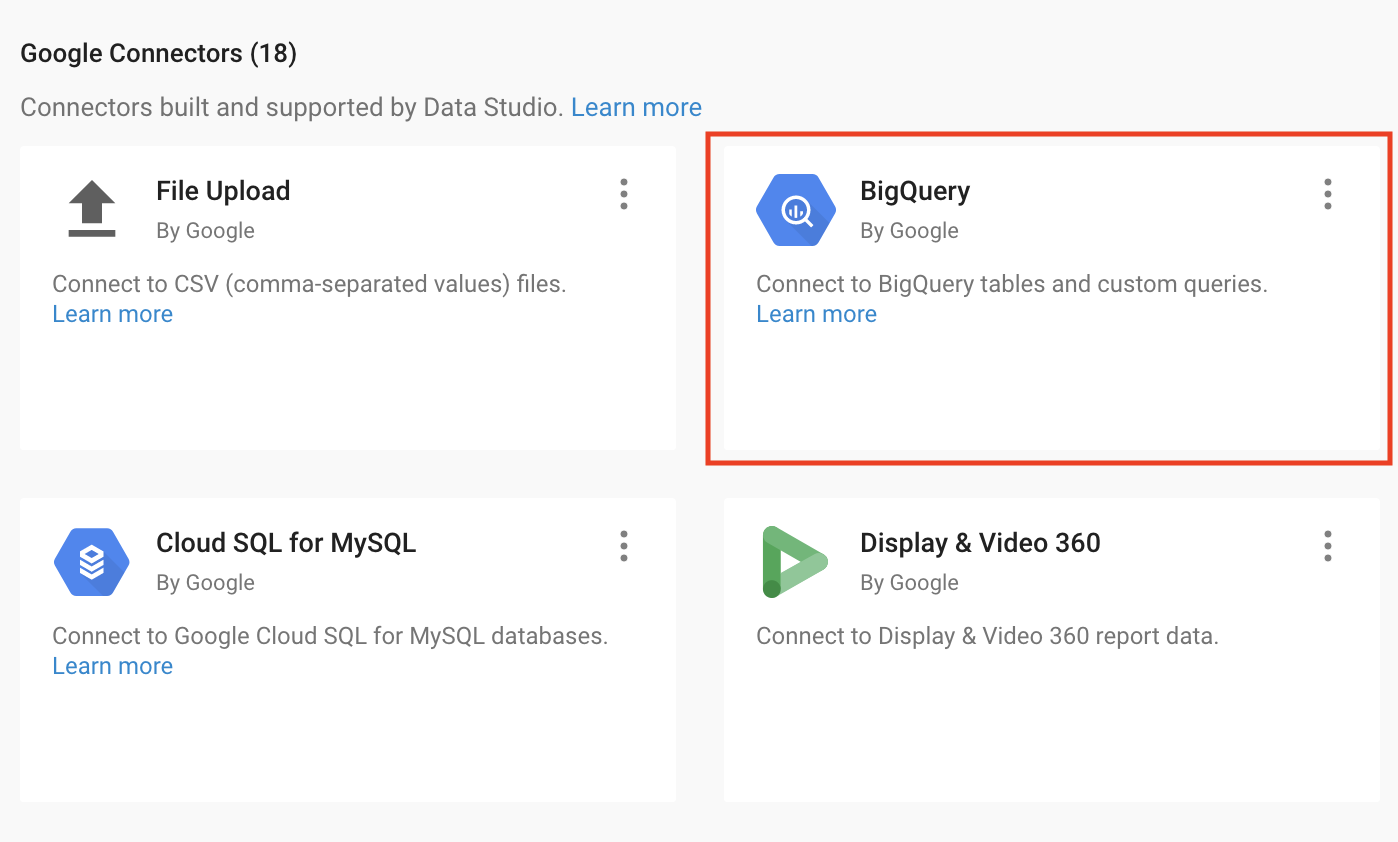
In the Google Connectors section, select BigQuery.
-
For Authorization, click Authorize. This allows Looker Studio access to your Google Cloud project.
-
Define your project:
- Click on Shared projects > your Project ID, which is found in the Lab details panel (begins with qwiklabs-).
- For Shared project name type "data-to-insights".
- For Dataset select ecommerce.
- For Table select sales_report.
-
Click Add in the bottom right corner and then click Add to report.
-
A preview of the available fields you can add to the report opens.
-
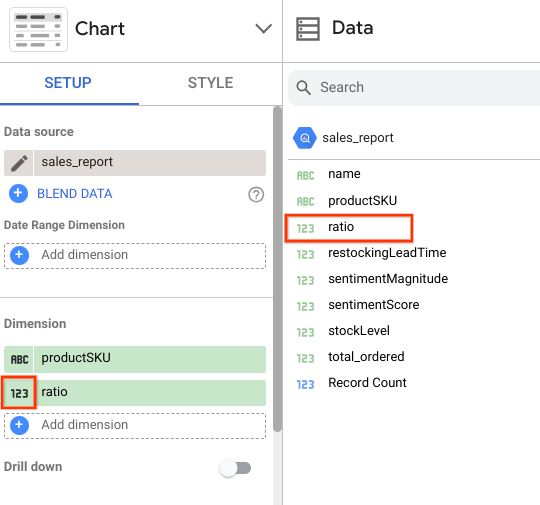
Under Data Field, click on ratio, and drag it into the Dimension section.
-
Click in the number icon to edit.
- Scroll down to the Type area, and use the dropdown menu to select Numeric > Percent.
You should now see the ratio column added with values as a percentage.
- Delete the table that was created for you - you will now create a report with a customized table.
Click Check my progress to verify the objective.
Task 2. Customize a report
Now add some visuals and interactive filters for your report users.
Add a report title and page title
- In the top-left, click "Untitled Report" and rename it
Ecommerce Product Operations Report. - In the reporting tools menu bar, click on the text icon (looks like a boxed in A).
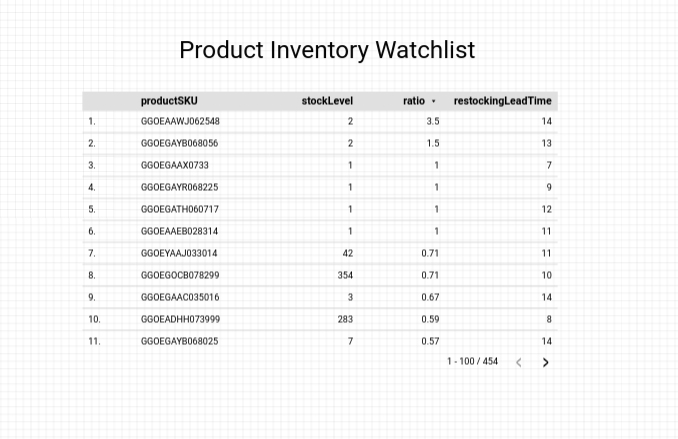
- Click onto a blank area in your report. In the text area, type
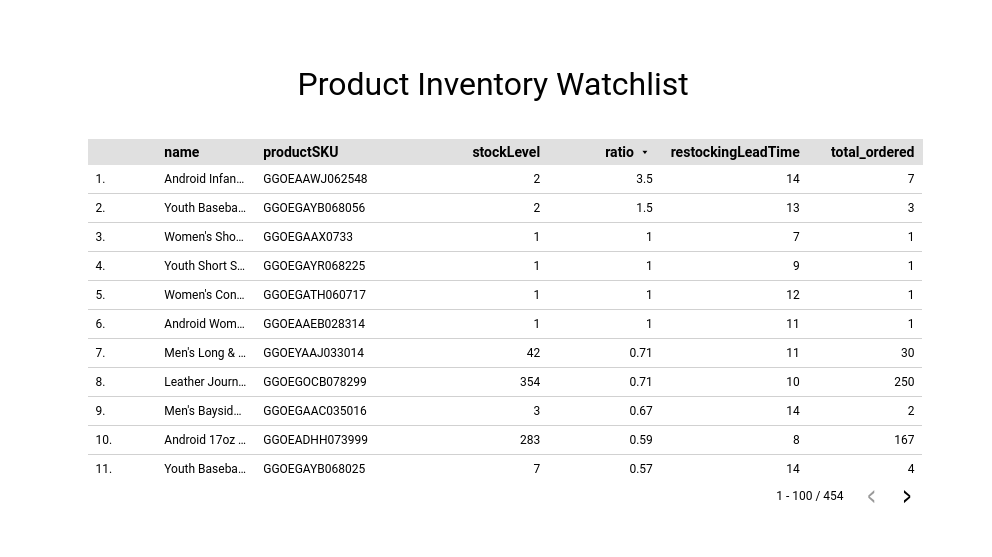
Product Inventory Watchlist. - Highlight the text in the text area and in the Text Properties panel, increase the font size to 32px. You may need to adjust your text box so it fits correctly.
Create a data table
-
From the menu bar, select Insert > Table. Click onto the report to drop your table. Feel free to adjust the size of this table and the width of the columns.
-
In the new Chart panel that opens, specify the following in the Setup tab:
- If productSKU is not present in the Dimension section, click productSKU from the Data field section and drag it to the Add dimension field.
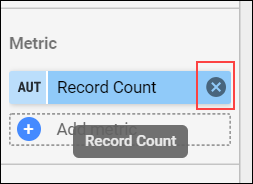
- In the Metric section, if present, remove Record count as a Metric by clicking x.
- Add stockLevel to the Metric area.
- Drag ratio to add it as a new Metric
- Drag restockingLeadTime to add it as a new Metric
- In the Sort field, click on productSKU and choose ratio from the dropdown menu for the new Sort field.
- Specify Descending.
-
In the Chart table, click the Style tab.
-
Under Table header, check Wrap text.
-
Manually adjust the widths of the table columns by hovering over the vertical border and click and dragging.
-
Confirm your report looks visually similar to the report below:
Create an interactive filter
- Click on your Setup tab.
- Under Data Field, click on name, and drag it into the Dimension section above
productSKU. - Similarly, drag total_ordered into the metric section below
restockingLeadTime. - In the upper-right, select the View button to preview your report. You should be presented with the following:
Congratulations!
You've successfully created a basic report in Looker Studio. Continue exploring new chart types and connect to additional data sources for richer, more visual reporting.
Next steps/ Learn more
Learn more about What you can do with Looker Studio.
Google Cloud training and certification
...helps you make the most of Google Cloud technologies. Our classes include technical skills and best practices to help you get up to speed quickly and continue your learning journey. We offer fundamental to advanced level training, with on-demand, live, and virtual options to suit your busy schedule. Certifications help you validate and prove your skill and expertise in Google Cloud technologies.
Manual Last Updated April 04, 2024
Lab Last Tested April 04, 2024
Copyright 2024 Google LLC All rights reserved. Google and the Google logo are trademarks of Google LLC. All other company and product names may be trademarks of the respective companies with which they are associated.