Checkpoints
Create a GCS bucket
/ 25
Create an instance template
/ 25
Create an instance group
/ 25
Configure autoscaling for the instance group
/ 25
Autoscaling an Instance Group with Custom Cloud Monitoring Metrics
- GSP087
- Overview
- Objectives
- Setup and requirements
- Task 1. Creating the application
- Task 2. Create a bucket
- Task 3. Creating an instance template
- Task 4. Creating the instance group
- Task 5. Verifying that the instance group has been created
- Task 6. Verifying that the Node.js script is running
- Task 7. Configure autoscaling for the instance groups
- Task 8. Watching the instance group perform autoscaling
- Task 9. Autoscaling example
- Congratulations!
GSP087
Overview
In this lab you will create a Compute Engine managed instance group that autoscales based on the value of a custom Cloud Monitoring metric.
Application architecture
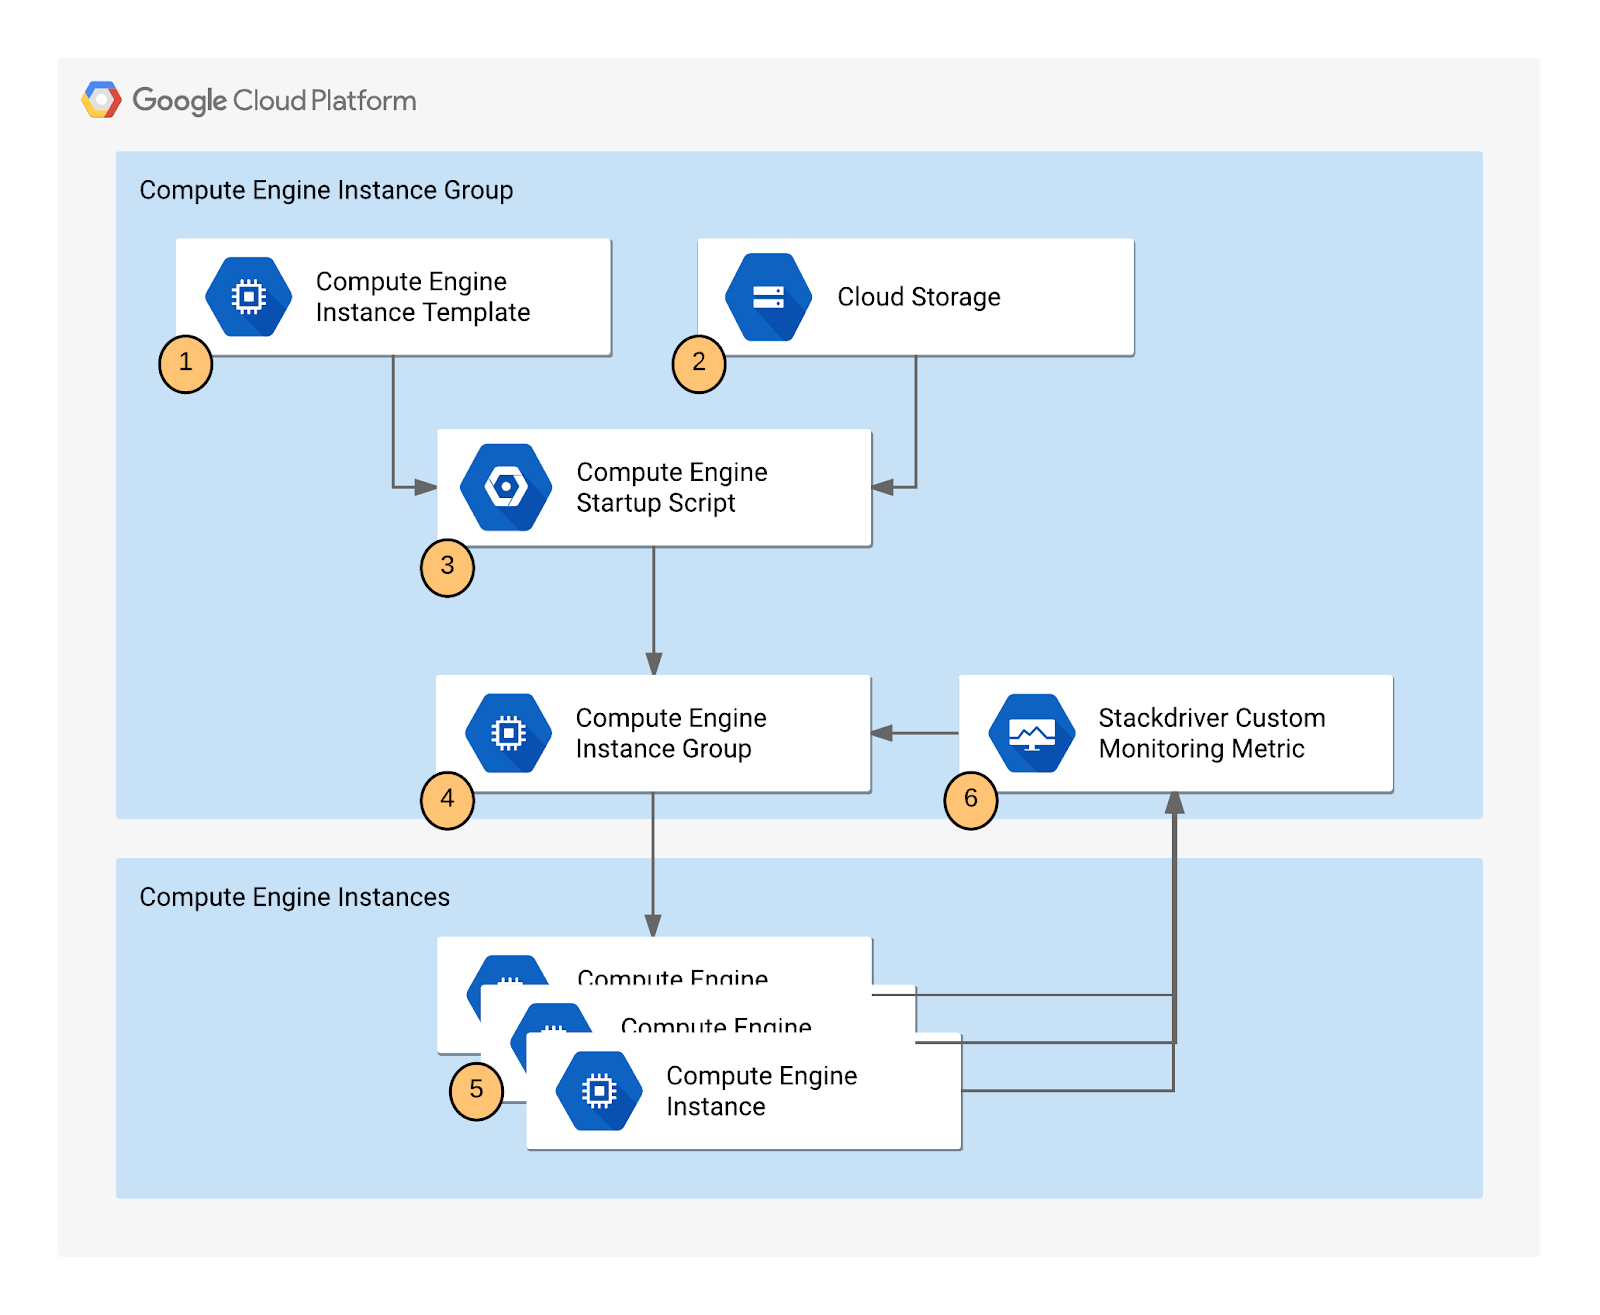
The autoscaling application uses a Node.js script installed on Compute Engine instances. The script reports a numeric value to a Cloud monitoring metric. You do not need to know Node.js or JavaScript for this lab. In response to the value of the metric, the application autoscales the Compute Engine instance group up or down as needed.
The Node.js script is used to seed a custom metric with values that the instance group can respond to. In a production environment, you would base autoscaling on a metric that is relevant to your use case.
The application includes the following components:
- Compute Engine instance template - A template used to create each instance in the instance group.
- Cloud Storage - A bucket used to host the startup script and other script files.
- Compute Engine startup script - A startup script that installs the necessary code components on each instance. The startup script is installed and started automatically when an instance starts. When the startup script runs, it in turn installs and starts code on the instance that writes values to the Cloud monitoring custom metric.
- Compute Engine instance group - An instance group that autoscales based on the Cloud monitoring metric values.
- Compute Engine instances - A variable number of Compute Engine instances.
- Custom Cloud Monitoring metric - A custom monitoring metric used as the input value for Compute Engine instance group autoscaling.
Objectives
In this lab, you will learn how to perform the following tasks:
- Deploy an autoscaling Compute Engine instance group.
- Create a custom metric used to scale the instance group.
- Use the Cloud Console to visualize the custom metric and instance group size.
Setup and requirements
Before you click the Start Lab button
Read these instructions. Labs are timed and you cannot pause them. The timer, which starts when you click Start Lab, shows how long Google Cloud resources will be made available to you.
This hands-on lab lets you do the lab activities yourself in a real cloud environment, not in a simulation or demo environment. It does so by giving you new, temporary credentials that you use to sign in and access Google Cloud for the duration of the lab.
To complete this lab, you need:
- Access to a standard internet browser (Chrome browser recommended).
- Time to complete the lab---remember, once you start, you cannot pause a lab.
How to start your lab and sign in to the Google Cloud console
-
Click the Start Lab button. If you need to pay for the lab, a pop-up opens for you to select your payment method. On the left is the Lab Details panel with the following:
- The Open Google Cloud console button
- Time remaining
- The temporary credentials that you must use for this lab
- Other information, if needed, to step through this lab
-
Click Open Google Cloud console (or right-click and select Open Link in Incognito Window if you are running the Chrome browser).
The lab spins up resources, and then opens another tab that shows the Sign in page.
Tip: Arrange the tabs in separate windows, side-by-side.
Note: If you see the Choose an account dialog, click Use Another Account. -
If necessary, copy the Username below and paste it into the Sign in dialog.
{{{user_0.username | "Username"}}} You can also find the Username in the Lab Details panel.
-
Click Next.
-
Copy the Password below and paste it into the Welcome dialog.
{{{user_0.password | "Password"}}} You can also find the Password in the Lab Details panel.
-
Click Next.
Important: You must use the credentials the lab provides you. Do not use your Google Cloud account credentials. Note: Using your own Google Cloud account for this lab may incur extra charges. -
Click through the subsequent pages:
- Accept the terms and conditions.
- Do not add recovery options or two-factor authentication (because this is a temporary account).
- Do not sign up for free trials.
After a few moments, the Google Cloud console opens in this tab.

Activate Cloud Shell
Cloud Shell is a virtual machine that is loaded with development tools. It offers a persistent 5GB home directory and runs on the Google Cloud. Cloud Shell provides command-line access to your Google Cloud resources.
- Click Activate Cloud Shell
at the top of the Google Cloud console.
When you are connected, you are already authenticated, and the project is set to your Project_ID,
gcloud is the command-line tool for Google Cloud. It comes pre-installed on Cloud Shell and supports tab-completion.
- (Optional) You can list the active account name with this command:
- Click Authorize.
Output:
- (Optional) You can list the project ID with this command:
Output:
gcloud, in Google Cloud, refer to the gcloud CLI overview guide.
Task 1. Creating the application
Creating the autoscaling application requires downloading the necessary code components, creating a managed instance group, and configuring autoscaling for the managed instance group.
Uploading the script files to Cloud Storage
During autoscaling, the instance group will need to create new Compute Engine instances. When it does, it creates the instances based on an instance template. Each instance needs a startup script. Therefore, the template needs a way to reference the startup script. Compute Engine supports using Cloud Storage buckets as a source for your startup script. In this section, you will make a copy of the startup script and application files for a sample application used by this lab that pushes a pattern of data into a custom Cloud logging metric that you can then use to configure as the metric that controls the autoscaling behavior for an autoscaling group.
Task 2. Create a bucket
-
In the Cloud Console, from the Navigation menu select Cloud Storage > Buckets, then click Create.
-
Give your bucket a unique name, but don't use a name you might want to use in another project. For details about how to name a bucket, see the bucket naming guidelines. You can use your Project ID for the bucket. This bucket will be referenced as
YOUR_BUCKETthroughout the lab. -
Accept the default values then click Create.
Click Confirm for Public access will be prevented pop-up if prompted.
When the bucket is created, the Bucket details page opens.
Test completed task
Click Check my progress to verify your performed task. If you have successfully created a Cloud Storage bucket, you will see an assessment score.
- Next, run the following command in Cloud Shell to copy the startup script files from the lab default Cloud Storage bucket to your Cloud Storage bucket. Remember to replace
<YOUR BUCKET>with the name of the bucket you just made:
- After you upload the scripts, click Refresh on the Bucket details page. Your bucket should list the added files.
Understanding the code components
-
Startup.sh- A shell script that installs the necessary components to each Compute Engine instance as the instance is added to the managed instance group. -
writeToCustomMetric.js- A Node.js snippet that creates a custom monitoring metric whose value triggers scaling. To emulate real-world metric values, this script varies the value over time. In a production deployment, you replace this script with custom code that reports the monitoring metric that you're interested in, such as a processing queue value. -
Config.json- A Node.js config file that specifies the values for the custom monitoring metric and used inwriteToCustomMetric.js. -
Package.json- A Node.js package file that specifies standard installation and dependencies forwriteToCustomMetric.js. -
writeToCustomMetric.sh- A shell script that continuously runs thewriteToCustomMetric.jsprogram on each Compute Engine instance.
Task 3. Creating an instance template
Now create a template for the instances that are created in the instance group that will use autoscaling. As part of the template, you specify the location (in Cloud Storage) of the startup script that should run when the instance starts.
-
In the Cloud Console, click Navigation menu > Compute Engine > Instance templates.
-
Click Create Instance Template at the top of the page.
-
Name the instance template
autoscaling-instance01. -
Scroll down, click Advanced options.
-
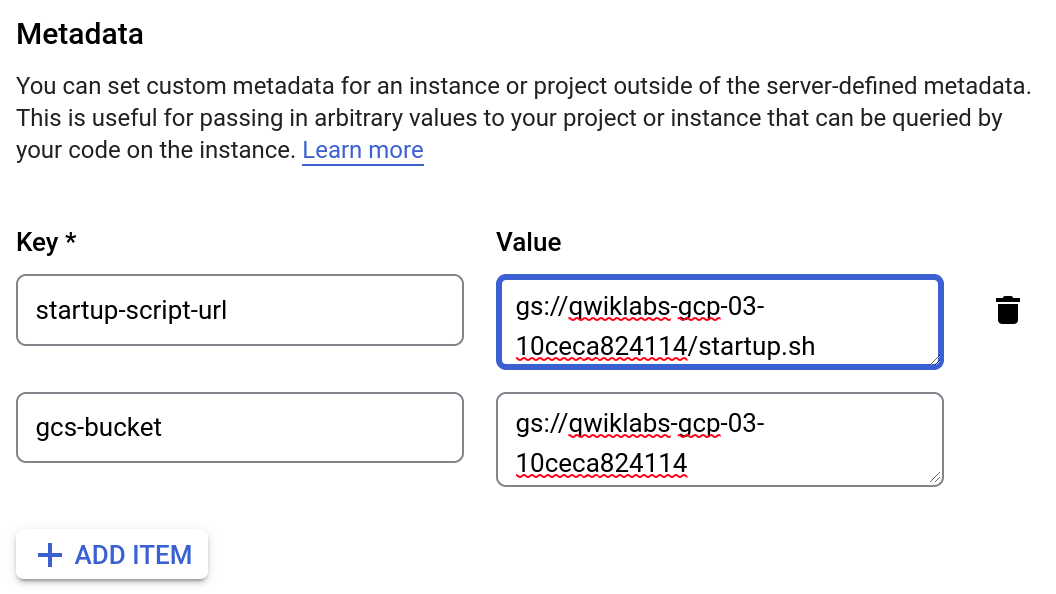
In the Metadata section of the Management tab, enter these metadata keys and values, clicking the + Add item button to add each one. Remember to substitute your bucket name for the
[YOUR_BUCKET_NAME]placeholder:
| Key | Value |
|---|---|
| startup-script-url | gs://[YOUR_BUCKET_NAME]/startup.sh |
| gcs-bucket | gs://[YOUR_BUCKET_NAME] |
- Click Create.
Test completed task
Click Check my progress to verify your performed task. If you have successfully created an instance template, you will see an assessment score.
Task 4. Creating the instance group
-
In the left pane, click Instance groups.
-
Click Create instance group at the top of the page.
-
Name:
autoscaling-instance-group-1. -
For Instance template, select the instance template you just created.
-
For Location, select Single Zone and use
and for the region and zone, respectively. -
Set Autoscaling mode to Off: do not autoscale.
You'll edit the autoscaling setting after the instance group has been created. Leave the other settings at their default values.
- Click Create.
Autoscaling is turned off. The number of instances in the group won't change automatically. The autoscaling configuration is preserved. warning next to your instance group. Test completed task
Click Check my progress to verify your performed task. If you have successfully created an instance group, you will see an assessment score.
Task 5. Verifying that the instance group has been created
Wait to see the green check mark next to the new instance group you just created. It might take the startup script several minutes to complete installation and begin reporting values. Click Refresh if it seems to be taking more than a few minutes.
Task 6. Verifying that the Node.js script is running
The custom metric custom.googleapis.com/appdemo_queue_depth_01 isn't created until the first instance in the group is created and that instance begins reporting custom metric values.
You can verify that the writeToCustomMetric.js script is running on the first instance in the instance group by checking whether the instance is logging custom metric values.
-
Still in the Compute Engine Instance groups window, click the name of the
autoscaling-instance-group-1to display the instances that are running in the group. -
Scroll down and click the instance name. Because autoscaling has not started additional instances, there is just a single instance running.
-
In the Details tab, in the Logs section, click the Logging link to view the logs for the VM instance.
-
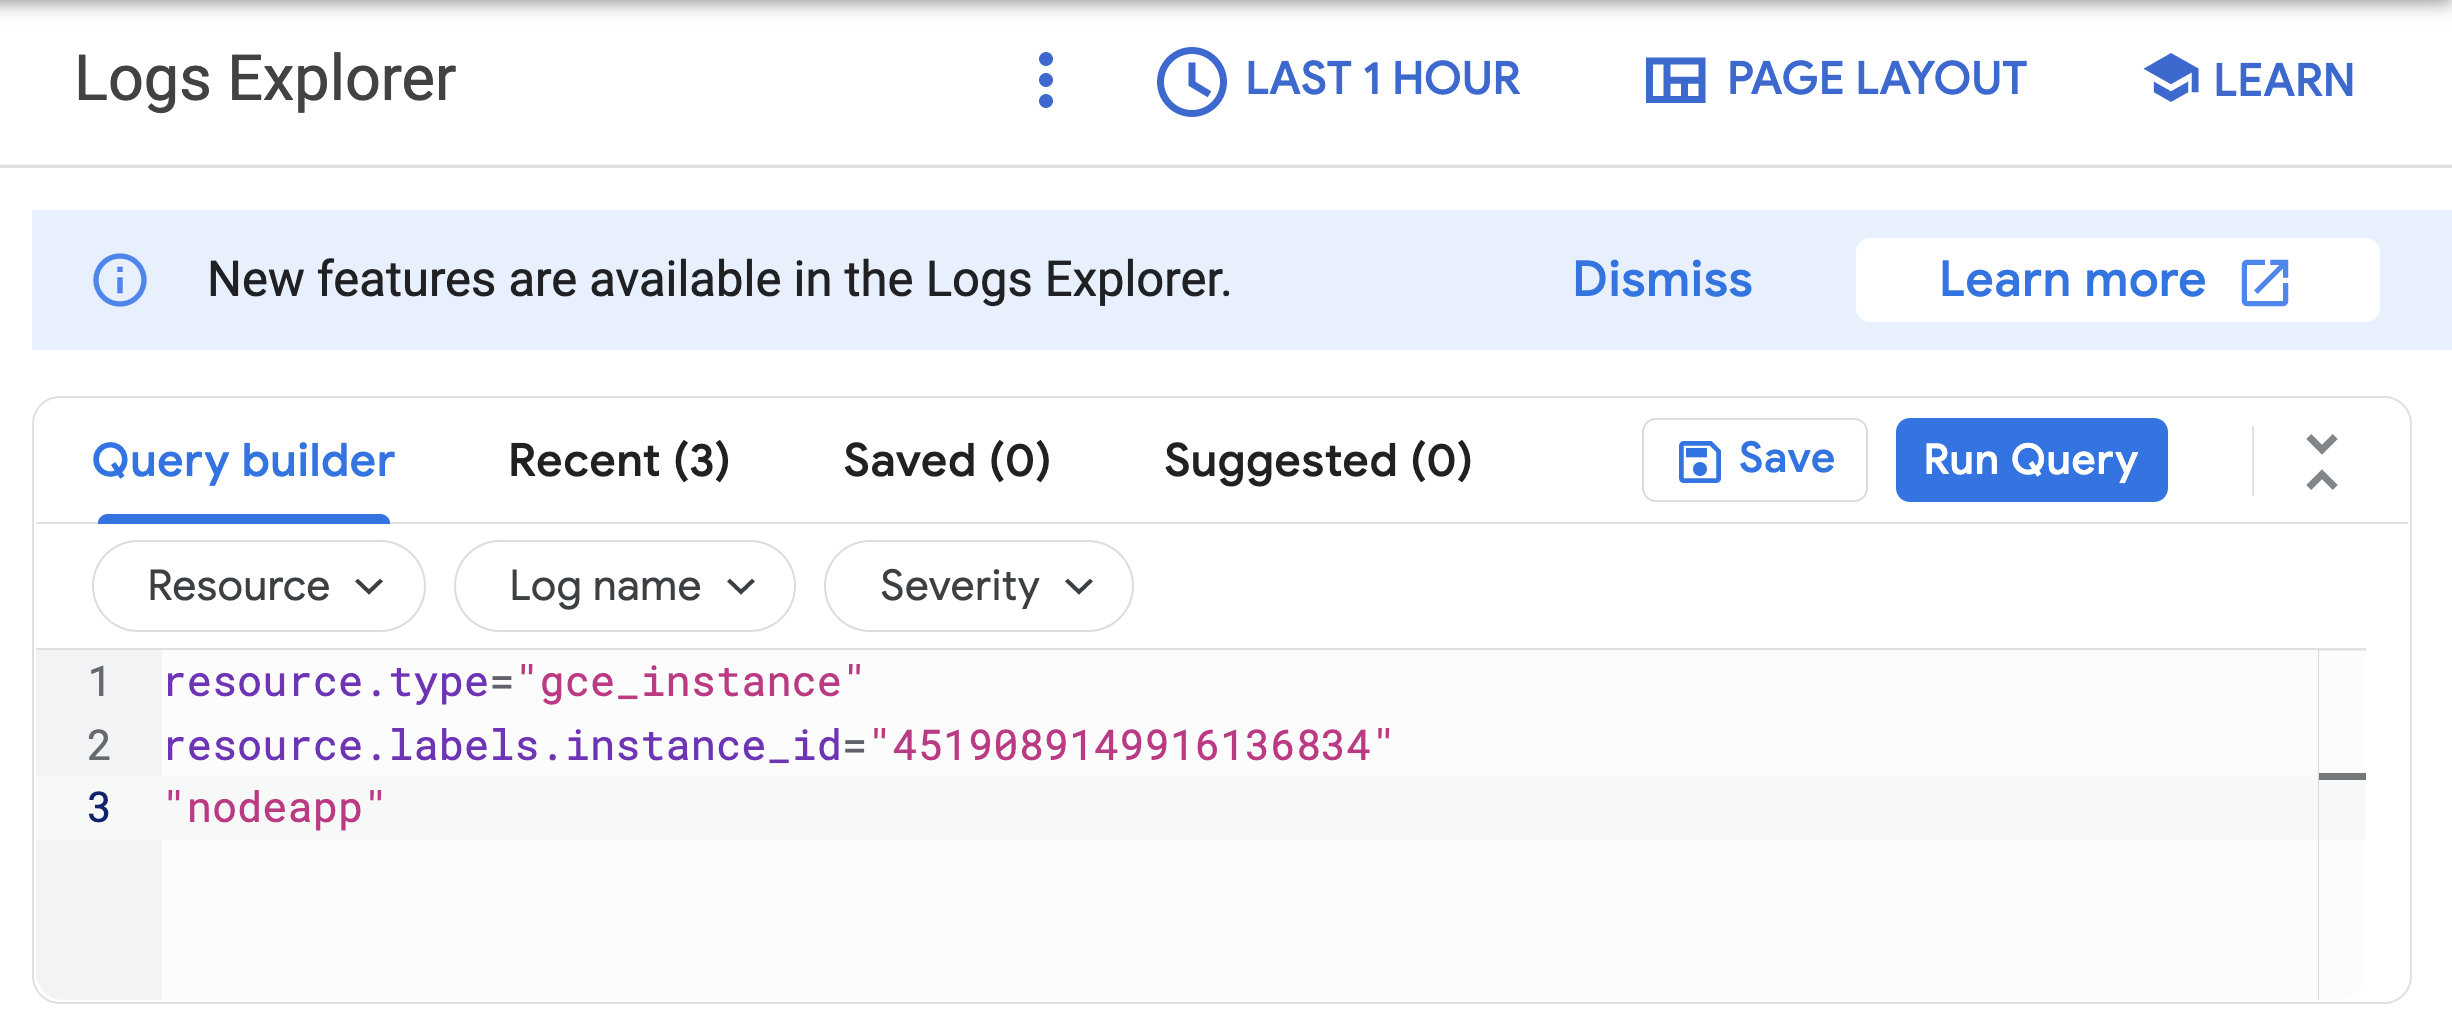
Wait a minute or 2 to let some data accumulate. Enable the Show query toggle, you will see
resource.typeandresource.labels.instance_idin the Query preview box.
- Add
"nodeapp"as line 3, so the code looks similar to this:
- Click Run query.
If the Node.js script is being executed on the Compute Engine instance, a request is sent to the API, and log entries that say nodeapp: available is displayed.
Task 7. Configure autoscaling for the instance groups
After you've verified that the custom metric is successfully reporting data from the first instance, the instance group can be configured to autoscale based on the value of the custom metric.
-
In the Cloud Console, go to Compute Engine > Instance groups.
-
Click the
autoscaling-instance-group-1group. -
Click Edit.
-
Under Autoscaling set Autoscaling mode to On: add and remove instances to the group.
-
Set Minimum number of instances:
1and Maximum number of instances:3 -
Under Autoscaling signals click ADD SIGNAL to edit metric. Set the following fields, leave all others at the default value.
-
Signal type:
Cloud Monitoring metric new. Click Configure. - Under Resource and metric click SELECT A METRIC and navigate to VM Instance > Custom metrics > Custom/appdemo_queue_depth_01.
- Click Apply.
-
Utilization target:
150
When custom monitoring metric values are higher or lower than the Target value, the autoscaler scales the managed instance group, increasing or decreasing the number of instances. The target value can be any double value, but for this lab, the value 150 was chosen because it matches the values being reported by the custom monitoring metric.
-
Utilization target type:
Gauge. Click Select.
The Gauge setting specifies that the autoscaler should compute the average value of the data collected over the last few minutes and compare it to the target value. (By contrast, setting Target mode to DELTA_PER_MINUTE or DELTA_PER_SECOND autoscales based on the observed rate of change rather than an average value.)
-
Signal type:
-
Click Save.
Test completed task
Click Check my progress to verify your performed task. If you have successfully configured autoscaling for the instance group, you will see an assessment score.
Task 8. Watching the instance group perform autoscaling
The Node.js script varies the custom metric values it reports from each instance over time. As the value of the metric goes up, the instance group scales up by adding Compute Engine instances. If the value goes down, the instance group detects this and scales down by removing instances. As noted earlier, the script emulates a real-world metric whose value might similarly fluctuate up and down.
Next, you will see how the instance group is scaling in response to the metric by clicking the Monitoring tab to view the Autoscaled size graph.
- In the left pane, click Instance groups.
- Click the
builtin-igminstance group in the list. - Click the Monitoring tab.
- Enable Auto Refresh.
Since this group had a head start, you can see the autoscaling details about the instance group in the autoscaling graph. The autoscaler will take about five minutes to correctly recognize the custom metric and it can take up to 10-15 minutes for the script to generate sufficient data to trigger the autoscaling behavior.
Hover your mouse over the graphs to see more details.
You can switch back to the instance group that you created to see how it's doing (there may not be enough time left in the lab to see any autoscaling on your instance group).
For the remainder of the time in your lab, you can watch the autoscaling graph move up and down as instances are added and removed.
Task 9. Autoscaling example
Read through this autoscaling example to see how capacity and number of autoscaled instances can work in a larger environment.
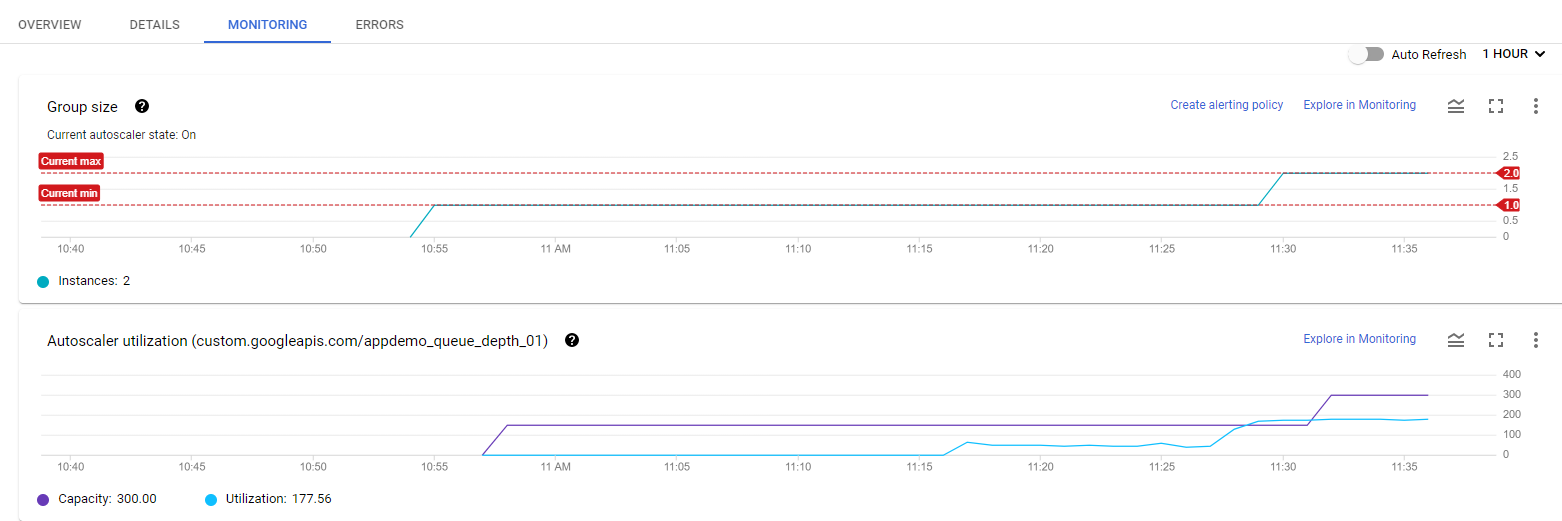
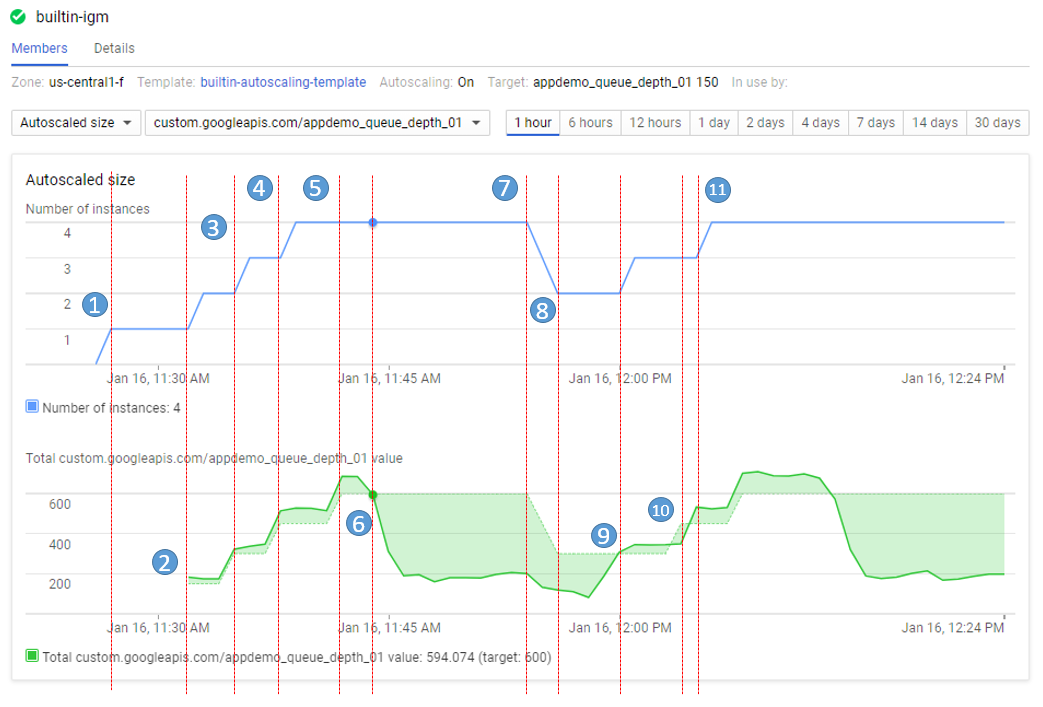
The number of instances depicted in the top graph changes as a result of the varying aggregate level of the custom metric property values reported in the lower graph. There is a slight delay of up to five minutes after each instance starts up before that instance begins to report its custom metric values. While your autoscaling starts up, read through this graph to understand what will be happening:
The script starts by generating high values for approximately 15 minutes in order to trigger scale-up behavior.
- 11:27 Autoscaling Group starts with a single instance. The aggregate custom metric target is 150.
- 11:31 Initial metric data acquired. As the metric is greater than the target of 150 the autoscaling group starts a second instance.
- 11:33 Custom metric data from the second instance starts to be acquired. The aggregate target is now 300. As the metric value is above 300 the autoscaling group starts the third instance.
- 11:37 Custom metric data from the third instance starts to be acquired. The aggregate target is now 450. As the cumulative metric value is above 450 the autoscaling group starts the fourth instance.
- 11:42 Custom metric data from the fourth instance starts to be acquired. The aggregate target is now 600. The cumulative metric value is now above the new target level of 600 but since the autoscaling group size limit has been reached no additional scale-up actions occur.
- 11:44 The application script has moved into a low metric 15 minute period. Even though the cumulative metric value is below the target of 600 scale-down must wait for a ten minute built-in scale-down delay to pass before making any changes.
- 11:54 Custom metric data has now been below the aggregate target level of 600 for a four node cluster for over 10 minutes. Scale-down down now removes two instances in quick succession.
- 11:56 Custom metric data from the removed nodes is eliminated from the autoscaling calculation and the aggregate target is reduced to 300.
- 12:00 The application script has moved back into a high metric 15 minute period. The cumulative custom metric value has risen above the aggregate target level of 300 again so the autoscaling group starts a third instance.
- 12:03 Custom metric data from the new instance have been acquired but the cumulative values reported remain below the target of 450 so autoscaling makes no changes.
- 12:04 Cumulative custom metric values rise above the target of 450 so autoscaling starts the fourth instance.
Congratulations!
Congratulations! In this lab, you created a Compute Engine managed instance group that autoscales based on the value of a custom Cloud Monitoring metric. You also learned how to use the Cloud Console to visualize the custom metric and instance group size.
Next steps / Learn more
- Learn more about Cloud Monitoring
- Learn more about Cloud custom monitoring metrics
- Learn more about autoscaling with Compute Engine
Google Cloud training and certification
...helps you make the most of Google Cloud technologies. Our classes include technical skills and best practices to help you get up to speed quickly and continue your learning journey. We offer fundamental to advanced level training, with on-demand, live, and virtual options to suit your busy schedule. Certifications help you validate and prove your skill and expertise in Google Cloud technologies.
Manual Last Updated February 07, 2024
Lab Last Tested February 07, 2024
Copyright 2024 Google LLC All rights reserved. Google and the Google logo are trademarks of Google LLC. All other company and product names may be trademarks of the respective companies with which they are associated.

